

To mark Global Running Day, Garmin released the latest global trends in running alongside a companion report on global cycling trends. Both draw on Garmin Connect data logged by users around the world, covering mileage, pace, resting heart rate, VO2 max, and functional threshold power. Here are the key takeaways and the most interesting numbers from each.
 Garmin published its global running and cycling data reports for Global Running Day. Image: Garmin.
- The average Garmin run was 4.82 miles — and the longest average runs came from 50–59 year-olds, not 20-somethings.
- Runners in Ireland were the fastest in the world, averaging a 9:09 per mile pace.
- Resting heart rate fell from 62.2 bpm for non-runners to 55 bpm for those running 31+ miles a week.
- Indoor running activities jumped 12.6% per capita year over year.
- 23% more runners paired a run with a strength workout in the same week versus a year earlier.
- The average bike ride was 28.59 miles and about 115 minutes — roughly the length of a feature film.
- Cyclists aged 60–69 climbed the most, gaining ~1,201 feet per ride — nearly the height of the Empire State Building.
- The fastest cyclists were in the UAE (17.75 mph), and the top 1% of riders averaged a 243 max FTP.
How far and how long Garmin runners run
The average run distance across all users was 4.82 miles. The longest average runs came from the 50–59 age group at 5.11 miles, while the 20–29 group logged the shortest at 4.6 miles. Average time per run was 46.3 minutes, peaking with the 60–69 group at 50.8 minutes.
 Average miles per run by age group. Source: Garmin.
Weekly mileage clustered in the 6–10 mile range, where nearly 40% of runners landed. Another 28% ran 11–20 miles a week, while just 3% logged more than 31 miles.
 Share of Garmin runners by average weekly mileage. Source: Garmin.
Pace: who runs fastest
The average pace was 9:21 per mile for men and 10:11 per mile for women. Pace slowed gradually with age, from 9:16 per mile for the 20–29 group to 10:57 per mile for runners over 70. European locales were quickest overall, led by Ireland (9:09 per mile), Portugal (9:12), and Italy (9:13).
 Average pace per mile by age group. Source: Garmin.
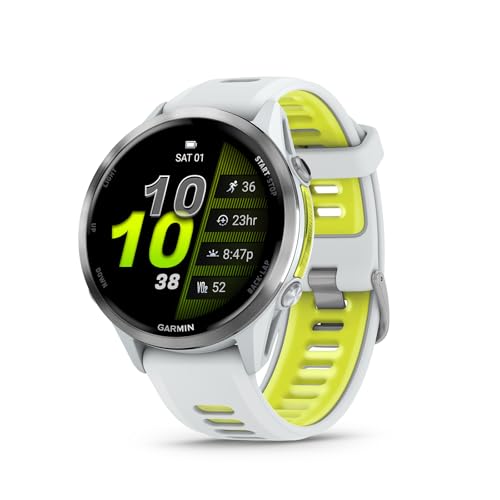
Running is growing worldwide
Running activity rose across every age group on a per-capita basis. Indoor running activities increased 12.6% per capita in 2025 versus 2024, while outdoor running rose 3.2%. The 30–39 age group recorded the largest year-over-year increase in average activities per user, at 5.3%.
 Year-over-year increase in average running activities per user, by age group. Source: Garmin.
By locale, South Korean users recorded the most activities per user for running, track running, and treadmill running, while users in France recorded the most trail running activities per user. August was the month with the most miles run, and Saturday was the most popular day of the week.

Sleep, heart rate, and VO2 max
Garmin runners tended to sleep better than non-runners, posting an average sleep score of 73 to 74 versus 70. Resting heart rate also dropped as weekly mileage increased, from 62.2 bpm for non-runners down to 55 bpm for those running 31 or more miles per week.
 Average resting heart rate by weekly mileage. Source: Garmin.
The average VO2 max for all Garmin runners was 50, running higher among younger runners and higher for men than women across every age group — from 57 for men aged 18–29 down to 41 for women over 70.
 Average best VO2 max by age group and gender. Source: Garmin.
Strength training is on the rise
Comparing 2024 to 2025, Garmin found a 23% increase in runners who recorded a run and a strength training activity in the same week. Among runners using Garmin Coach, the most popular distance to train for was the half marathon.
The beat on bikes: global cycling trends
Garmin’s companion report looked at data from cyclists riding with an Edge bike computer. The average ride covered 28.59 miles and lasted about 115 minutes, roughly the length of a feature film. The 60–69 age group rode the farthest per ride at 30.35 miles, narrowly ahead of the 20–29 group at 30.19 miles. By country, cyclists in Italy rode the farthest at 34.73 miles on average, ahead of Belgium (33.05 mi) and Spain (32.80 mi).
 Garmin’s companion report covered global cycling trends recorded with Edge bike computers. Image: Garmin.
 Average miles per ride by age group. Source: Garmin.

When cyclists ride
Rides peaked in the morning. About 11% of all rides started at 8 a.m. — the single most popular hour — with a smaller bump in the late afternoon.
 Share of rides by start time (24-hour clock). Source: Garmin.
How fast cyclists ride
The global average speed was 14.89 mph, and younger riders rode faster than older ones. The fastest locales globally were the United Arab Emirates (17.75 mph), Thailand (16.81 mph), and Malaysia (16.73 mph).
 Average cycling speed (mph) by age group. Source: Garmin.
How much they climb
Cyclists gained an average of 1,158 feet of elevation per ride. The 60–69 age group climbed the most at 1,201 feet — nearly the height of the Empire State Building. The locales with the most climbing per ride were Spain (1,704 ft), Colombia (1,678 ft), and Portugal (1,617 ft).
 Average elevation gain (feet) per ride by age group. Source: Garmin.
Functional threshold power (FTP)
FTP measures the power in watts a rider can sustain for about an hour. The average max FTP was 224 for men and 188 for women, declining gradually with age. FTP rose steadily with weekly mileage, and the top 1% of cyclists — riding 140 or more miles per week — averaged a max FTP of 243 versus 220 for everyone else. The best FTP locales were Norway (234), Slovakia (231), and the Czech Republic (228).
 Average max FTP by age group. Source: Garmin.

Cycling VO2 max
The average VO2 max for all Garmin cyclists was 51, again highest among younger riders. It climbed with mileage too: elite cyclists riding 160 or more miles per week averaged 62, compared with 51 for everyone else.
 Average cycling VO2 max by age group. Source: Garmin.
By activity growth, Belgium logged the biggest year-over-year increase in cycling activities (3.5%), followed by Luxembourg (2%) and Taiwan (1.7%).
When Garmin athletes train
Across both reports, August was the busiest month for distance. Runners logged the most miles on Saturdays, while cyclists recorded the most rides on Sundays. Garmin published the reports alongside a limited-time Global Running Day badge available in the Garmin Connect app.


No comments yet. Start the conversation.